

An Introduction to Using Machine Learning to Build your Trading Strategy
In this blog post series, I am going to step through building and testing a simple machine-learning strategy over an asset. In this first post, I cover the basic concepts of machine-learning and how it is applied to the financial markets.
Machine learning has become one of the most promising fields in quantitative finance, but has garnered a reputation for sophistication and complexity over the past couple of years. In reality it is not that difficult to work with.
The goal of machine learning is to accurately model historical data, then use that model to make predictions about the future. In quantitative finance, there are two types of machine learning:
A model needs to be created from historical data using independent and dependent variables. For classification models, the dependent variable is the next day price movement and the independent variables are indicators like moving average crosses or news events. Once the model has been created on historical data, it can be used to predict future price movements.
In my example I will be using the day of the week to predict Google’s next day’s close price (up or down. In the next blog post, we will use multiple indicators, but for the purpose of covering the concepts, we will use just one: the day of the week.
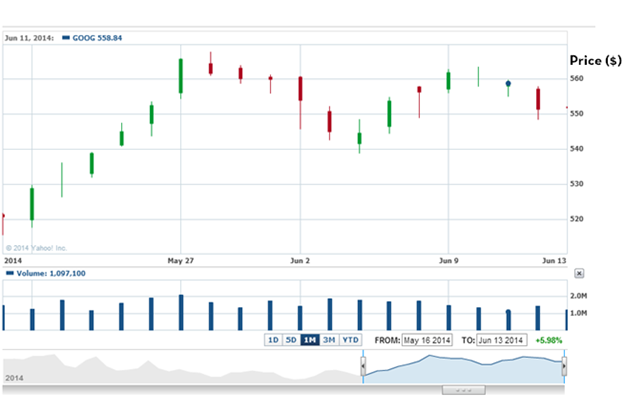
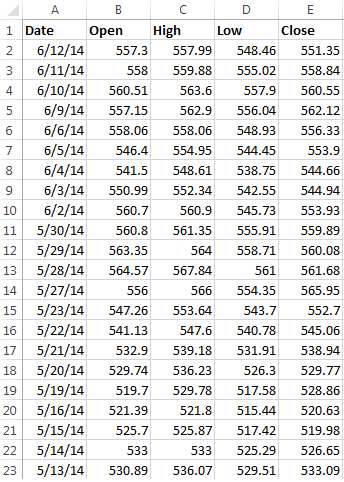
Below is a chart of Google and following is an image of the exported data. You can use Yahoo Finance for the purpose of example and I would highly recommend a more reliable data source for a model you are going to use to trade. When I trade I use the same data source that I trade over to create and test my model.
Google Inc. (GOOG) Daily Candles: May 16, 2014 – June 13, 2014
The next step is to make sure that I have the correct indicators and variable I am predicting. I know that I want to use the day of the week to predict the next day’s price movement. I made a column for the day of the week and a column for the close price minus the open price. Finally, I created a column that is “UP” if the difference between the close and open price is greater than 0 and “DOWN” if the difference is less than 0:
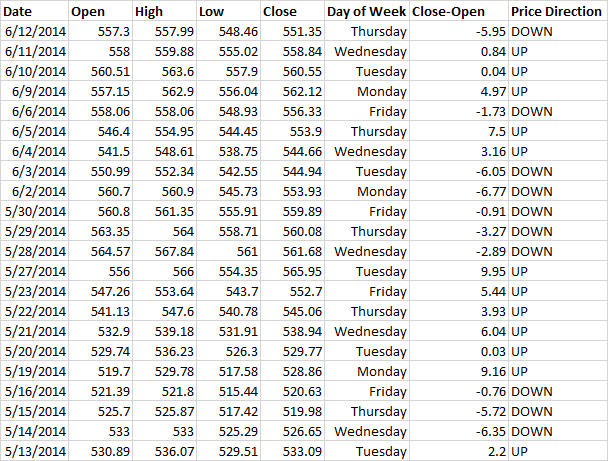
In machine learning, this data set is called the training set. It is called the training set because the algorithm is trained over this data. In other words, the algorithm studies the day of the week and its relationship to the price direction to discover and quantify a non-linear relationship. Note that this is a small sample of data; there are only 23 rows. In the next blog post, we will use hundreds of rows to build our model. Generally, the more data, the better.
Now, let’s select an algorithm to use. There are a number that you can use, including, Hidden Markov Models, artificial neural networks, a Naïve Bayes classifier, support vector machines, decision trees, and ANOVA to name a few of the more commonly used ones…. Here is a good list where you can dive into each algorithm and explore when they should be applied. I recommend using one of the more commonly used algorithms at first, for example, a support vector machine or a Naïve Bayes classifier. Don’t spend too much time selecting an algorithm, the most important parts of your analysis are the indicators you use and the variable you predict.
The day of week is our indicator that we are going to use to predict tomorrow’s price movement. We are going to use an algorithm to make the prediction. We are going to use historical data for the algorithm to “learn” or discover patterns between the day of week and the next day’s price movement.
In the next blog post, we will select an algorithm and create a model using R with step-by-step instructions.